 This blog article will be dedicated to SIP and SIP calls. It is meant to provide an introduction for UC Engineers to the main headers and guide through the debugging of the most popular call scenarios that will be described in the next articles.
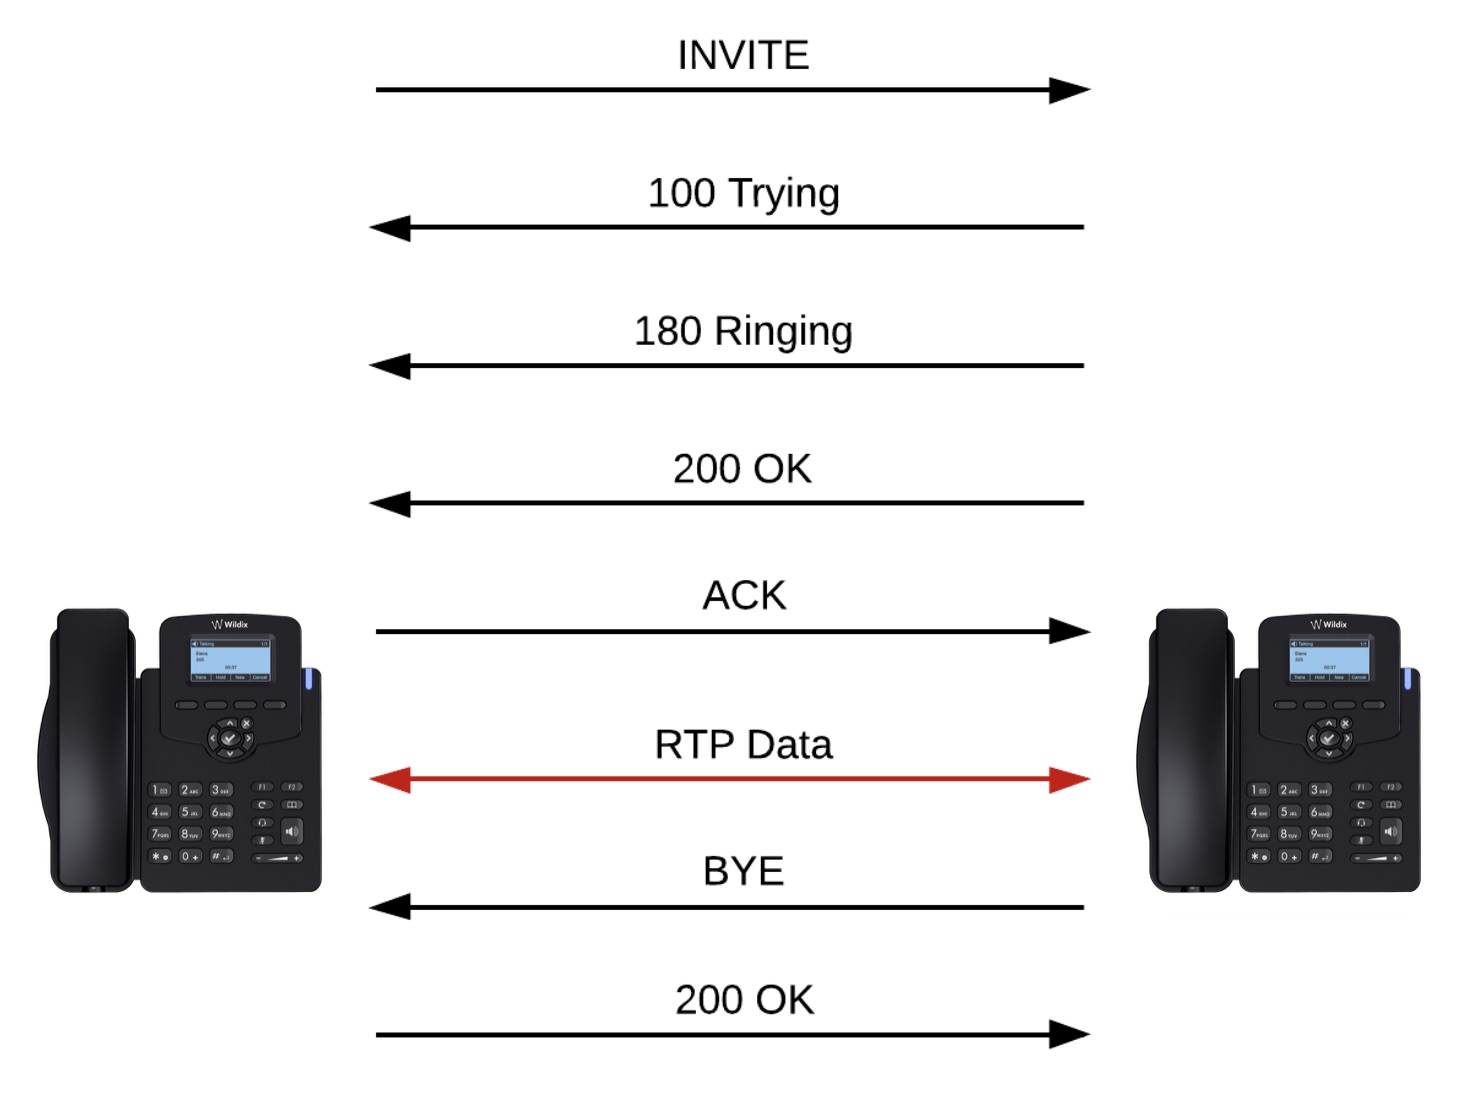
As we have seen in SIP and XMPP standards in Unified Communications and Media transfer in Unified Communications – SDP protocol, SIP (Session Initiation Protocol) and SDP-RTP have become the de facto replacement mode for traditional analog and digital lines provided by operators all over the world.
SIP is also the most popular signaling mode to handle VoIP calls.
Being able to understand SIP sessions has become for a Unified Communication Engineer as important as in the past for Telephony Experts to read signaling traces in Q.931 / Q.921 / DS1 / QSIG generated by T1 / E1 PRI – BRI ISDN lines.
Before Starting the Analysis
The first step to start the analysis of any SIP session is to have access to it.
Most applications allow seeing real time SIP sessions messages from a console. Although this mode is the most immediate the limitations are big – if the device handles a lot of calls, reading the log might be very difficult. I recommend this approach only to experienced VoIP Engineers.
The second and most comfortable way to generate and read an SIP Session is to create a Network Dump in pcap (packet capture) format file by using utilities such as Wireshark – tcpdump (which both use libpcap) – ngrep – and then read it using Wireshark.
Routers / Firewalls from many companies also integrate the possibility of generating pcap files. When generating network dumps on devices with high traffic, always apply filtering, to extract only those pieces of information that are useful for you and that you are going to save. Network dumps can quickly grow in size to gigabytes and make the analysis complicated.
Most operators still do not provide encrypted SIP signaling, so reading traces between a UC Platform and a VoIP operator is as easy as opening the trace, since all the information is exchanged in plain text.
If you are trying to debug an encrypted session, you need to revert to the first mode indicated above – generating a log of the session. Alternatively it is possible to feed the private encryption key of the server handling the TLS connection into Wireshark. This might not be possible if you are not the administrator of the server and cannot retrieve the private key.
Open the Network Trace
If you decided to obtain a log of the SIP session, this step is not necessary, as you already have all SIP messages belonging to the session in a readable format. Otherwise you need to install a Network Protocol Analyzer tool such as Wireshark and open the trace.
If you are using Wireshark, VoIP calls can be currently found by selecting Telephony – VoIP Calls, and looking for the list of available sessions.
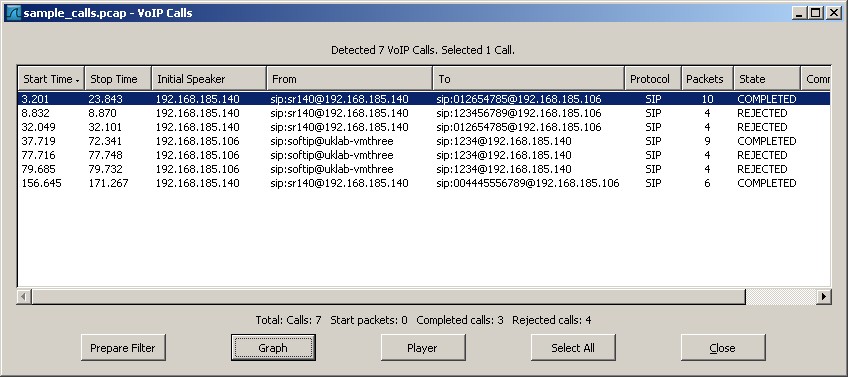 After finding the ones you want to analyze and pressing Graph you should see something similar to the diagram below:
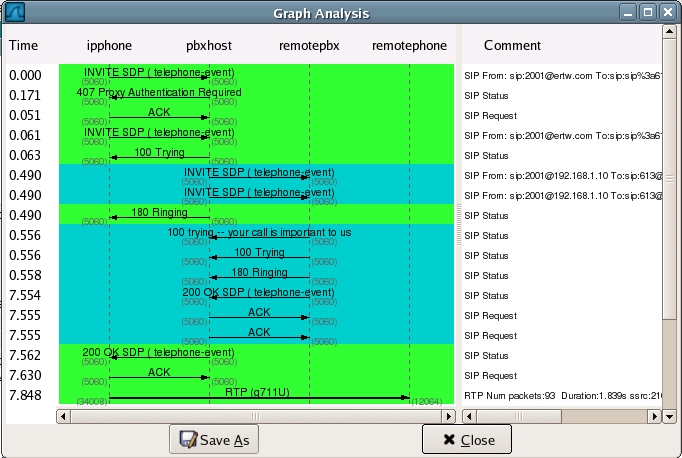
Now that we know how to obtain an SIP Session, we can proceed ahead.
Next time we will examine and understand what the meaning of each method is.

Information request: